Category: <span>Market Byte</span>

What is Really Driving Brisbane Office Valuations?

June 9, 2026

The traditional commercial real estate play-book is undergoing a significant re-pricing. For decades, institutional investors and corporate tenants relied heavily on a rigid grading system. If an office tower carried a Premium or A-Grade badge, it was considered a guaranteed performer.

However, recent global data shows a major structural shift. A wide twenty-percentage-point valuation gap has emerged between the top and bottom tiers of premium towers. This trend is playing out acutely right here in the Brisbane central business district (CBD) and its near-city fringes.

The commercial market is bifurcating rapidly. Success is no longer determined by an official label. Instead, it relies on prime location and the physical ability of an individual asset to adapt to modern workplace demands.

The Academic Foundation: Flight to Quality

This market behaviour aligns with long-standing economic research. An influential study on changing price spreads investigated how economic downturns impact pricing and turnover in office markets. The full analysis in the paper is available at “Flight to Quality? An Investigation of Changing Price Spreads in Commercial Real Estate Markets”.

The main findings are:

  • Widening Price Spreads: The price gap between top-tier properties (Class A) and lower-tier properties (Class B or C) grows significantly during downturns.
  • The Flight to Quality: During economic turmoil, investors regularly shift away from higher-risk assets to safer, premium assets.
  • Variable Attribute Pricing: Property characteristics such as size, height, and age are valued differently depending on whether the economy is rising or falling.
  • Impact on Turnover: Downturns cause significant variations in transaction turnover across quality tiers, largely driven by illiquidity among lower-tier buildings during recessions.

The Brisbane Context: A Tale of Two Markets

Brisbane serves as a textbook example of this real estate divide. According to recent Property Council of Australia (PCA) and commercial research data, the Brisbane CBD headline vacancy rate has hovered between 9.8 percent and 11.8 percent . However, looking at the headline figure alone hides a much more dramatic story of divergence between asset classes.

While secondary and B-Grade assets face deep structural vacancy challenges, tenant interest remains heavily concentrated in prime assets. The delivery of major new premium spaces, such as 360 Queen Street and 205 North Quay, briefly bumped headline vacancy numbers up as new supply entered the market. Yet, these premium spaces benefit from incredibly high pre-commitment levels, proving that occupiers are waiting in line for top-tier environments.

Conversely, the near-city and fringe markets tell a completely different story. Vacancy rates in those peripheral, unrefurbished areas are lagging far behind, hovering around fifteen percent. Corporate tenants are hyper-focused on location. In a bid to encourage workers back into physical offices, businesses are prioritising central, highly accessible locations. Proximity to major transit networks, retail hubs, and upcoming infrastructure updates like the Cross River Rail nodes provides an immediate competitive advantage, directly improving employee commuting and staff retention.
(Niche Advisory Brisbane)

Widening Rental Premiums and Scarcity

Brisbane’s prime market is exceptionally tight because it features a lower proportion of prime stock (around 59.8 percent) compared to Sydney and Melbourne. This local scarcity, combined with specific regional tailwinds, has accelerated the shift toward premium spaces. Just as the academic research highlights that top-tier assets maintain immense pricing power during structural shifts, Brisbane’s rental spread has expanded dramatically:

  • Premium and A-Grade Surge: Net effective rents for Premium-grade assets in Brisbane have seen an immense upward trajectory. Annual growth has exceeded 13.8 percent for top-tier properties, with A-Grade spaces recording even steeper year-on-year increases.
  • Secondary Market Lag: Secondary assets are lagging far behind in rent growth. Owners of rigid, un-refurbished buildings are being forced to offer massive tenant incentives, frequently pushing close to fifty percent, just to secure occupiers and maintain baseline occupancy.

The medium-term macro outlook remains highly confident. Sustained demand from professional services, major government tenant expansions, and the long-term infrastructure runway leading up to the Brisbane 2032 Olympics are keeping a firm floor under prime office demand.

Beyond the Label: Adaptability and Local Benchmarks

To put this into geographical context on the market map, specific assets demonstrate exactly where capital is flowing. 1 William Street remains a benchmark for major institutional and government occupancy on the riverfront. Meanwhile, assets like 144 Edward Street and major financial hub locations like Corporate House (1 Eagle Street) demonstrate how premium positioning and turnkey, high-amenity fitouts are being successfully utilised to draw teams back to the CBD.

A revealing metric from recent leasing tracking highlights this shift. Out of 136 major corporate tenant relocations in the Brisbane market, only 17 organisations chose secondary assets. The remaining vast majority moved into prime, amenity-rich spaces.

Anatomy of the Ideal Asset
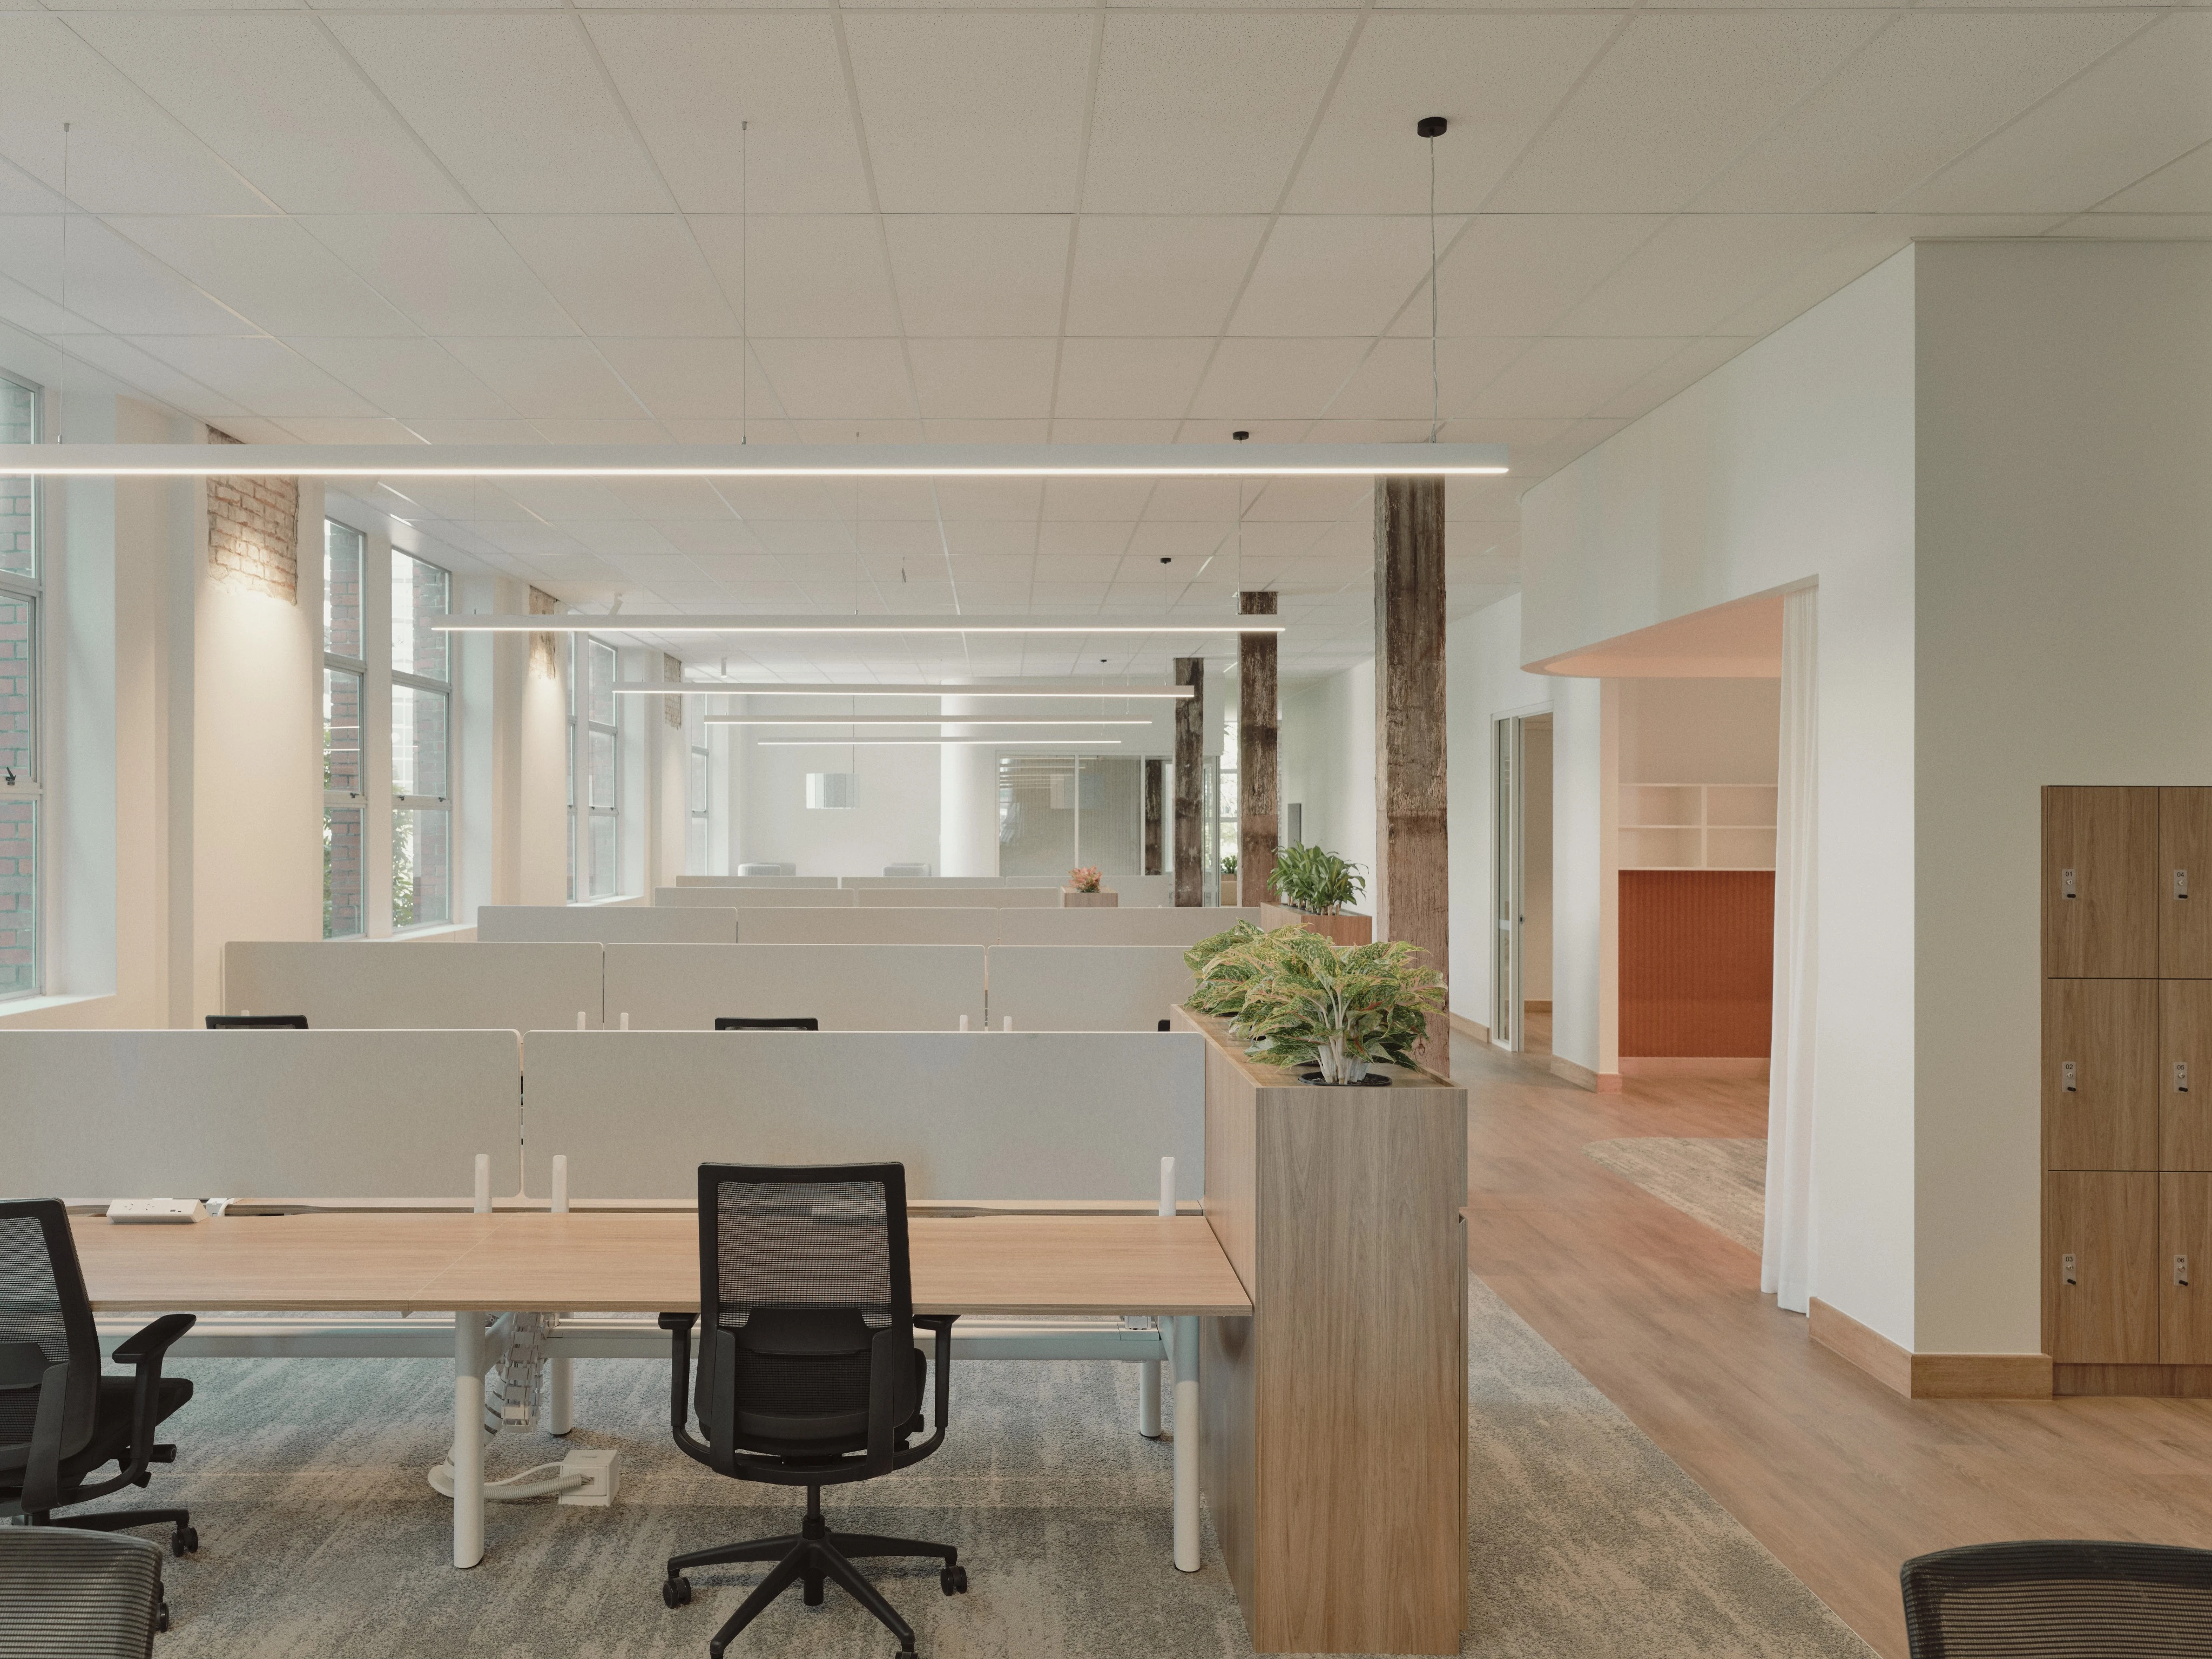
Modern activity-based tenant office layout Source: Client provided 93 Edward Street

To secure premium rental rates and avoid prolonged vacancy, a commercial building can no longer function as a static grid of desks. It must be viewed as a flexible, tech-enabled ecosystem designed around hospitality, collaboration, and environmental wellness. The most successful assets in the current Brisbane market incorporate several non-negotiable physical traits:

  • The Hospitality-Driven Ground Floor: The traditional corporate lobby has been replaced by a hotel-lounge experience. These spaces feature high-end café operators, informal breakout lounges, and flexible meeting spaces that remove the clinical feel of a standard entrance.
  • Activity-Based Tenancy Layouts: Modern layouts are optimised for zoning rather than fixed, open-plan seating. Floorplates must offer a mix of large, modular collaboration hubs with movable walls alongside soundproof, acoustic pods designed for virtual video calls.
  • Strict Environmental and Structural Credentials (ESG): High National Australian Built Environment Rating System (NABERS) and Green Star ratings are mandatory for institutional and government tenants. This includes smart, sensor-driven HVAC systems that optimise indoor air quality and natural light.
  • Hotel-Grade End-of-Trip (EOT) Facilities: To cater to active commuters, basements are being transformed into luxury wellness hubs. These spaces feature secure bicycle and e-scooter storage, rainfall showers, complimentary towel services, and premium styling amenities.
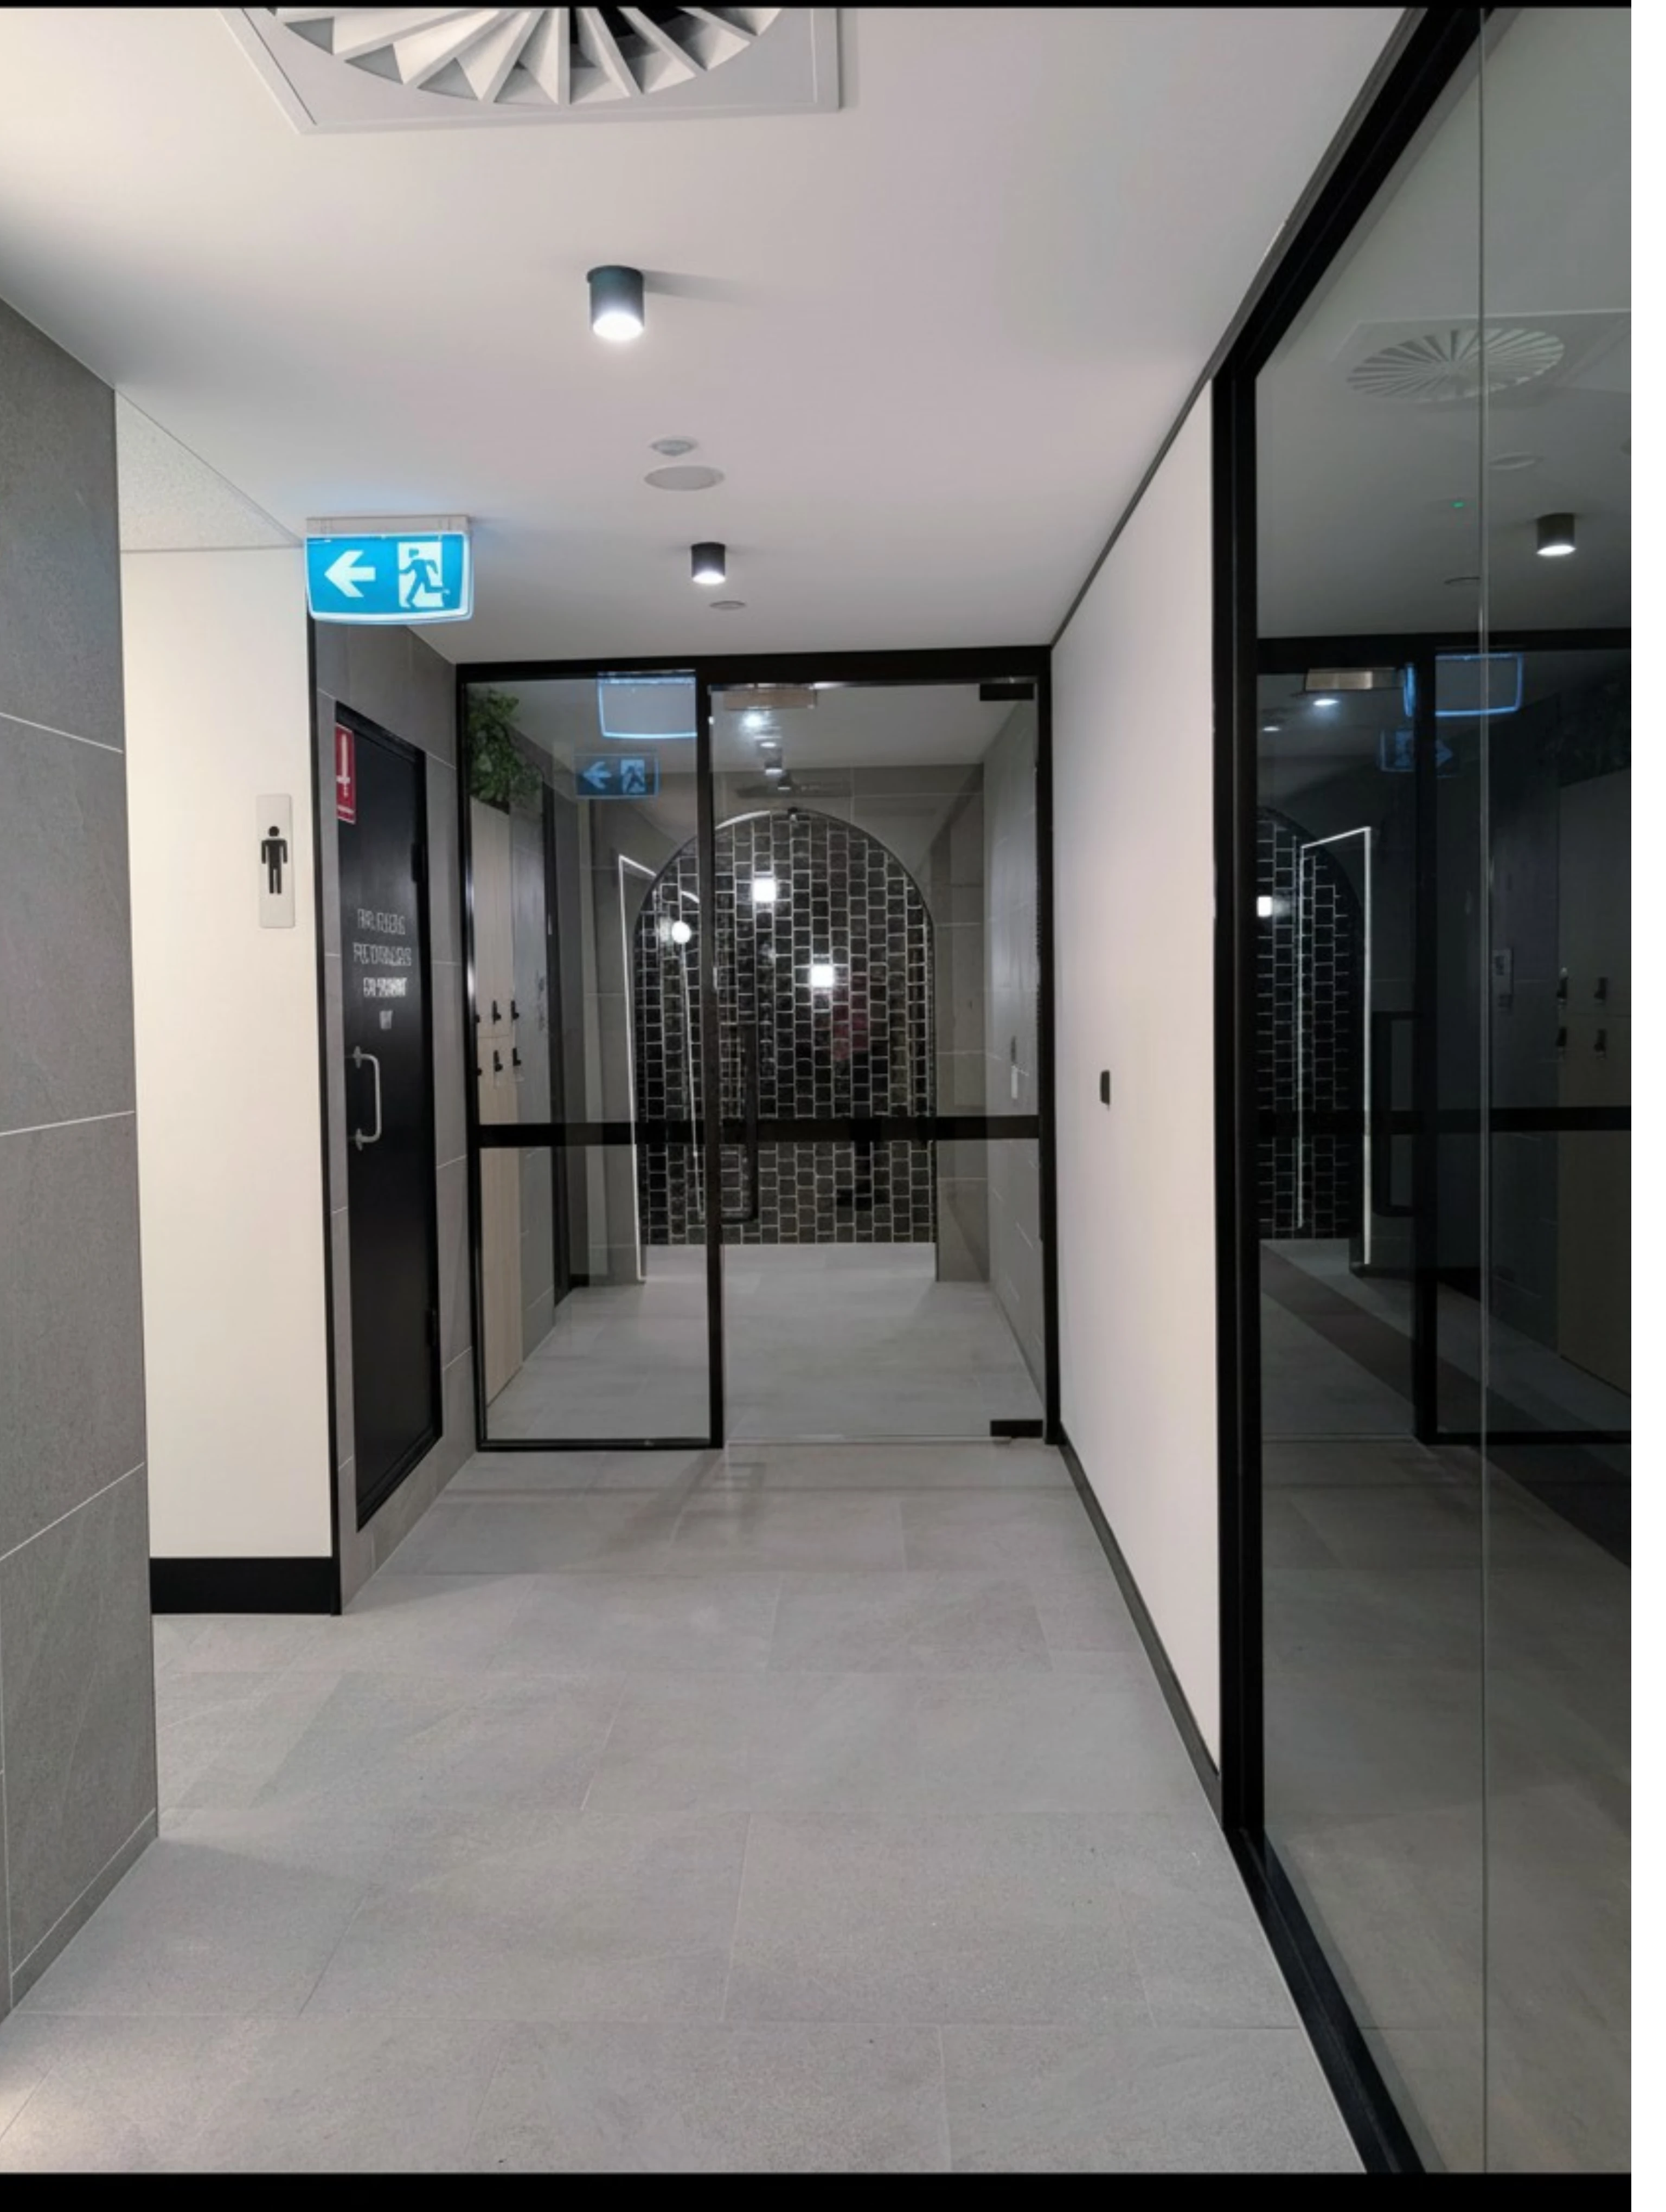
Hotel-grade end-of-trip facilities

Overcoming Secondary Status by Flipping it with CapEx

The shift toward asset performance over historical labels means that property owners are not completely powerless if they own an older asset. Capital expenditure can successfully alter market perception and tenant demand.

A local example of this repositioning is 201 Charlotte Street in Brisbane. The owners executed an extensive refurbishment program that upgraded the environmental credentials of the building. They also pre-installed high-quality, speculative fitted suites. Through this targeted investment, the asset successfully repositioned itself, moving from a B-Grade market perception into an active contender for A-Grade tenants.

Ultimately, Brisbane confirms the academic thesis: when a market undergoes a post-crisis or structural shift, premium assets with strong ESG metrics, wellness amenities, and central locations thrive, while secondary stock without upgrade potential faces severe occupancy pressure.

Case Study: 93 Edward Street – The Power of Strategic Asset Management

The post-pandemic commercial market shows that property owners are not powerless when facing an older asset. A prime example of this is 93 Edward Street in Brisbane, a commercial property where the landlord took a bold, proactive approach to counter market headwinds.

Instead of allowing the building to succumb to the leasing challenges affecting secondary stock, the landlord envisioned and funded a comprehensive capital expenditure and refurbishment program. They took on the heavy lifting, transforming traditional floorplates into highly flexible, tenant-centric environments and completely modernising the building features.

As the proud property management partner, McGees Property Brisbane stepped in to bring this vision to life operationally, managing the day-to-day facilities and executing the leasing strategy. Because of the landlord’s significant investment and commitment to quality, the asset was successfully insulated from market volatility. This powerful combination of landlord initiative and dedicated management completely altered the commercial outcome of the property, culminating in 93 Edward Street achieving a fully leased status in one of the most competitive leasing climates in Brisbane history.

Is Your Asset Accurately Positioned in the New Brisbane Landscape?

As the market continues to split, traditional building grades no longer guarantee asset performance. Relying on outdated market assumptions could mean leaving significant equity or rental income on the table.

Whether you are looking to benchmark your property’s current worth or map out a capital expenditure strategy to maximise returns, a precise, data-driven valuation is your most powerful tool.

Contact our expert commercial valuation team today for a confidential discussion about your property portfolio.

Michael Walsh

Head of Valuation and Professional Services (Associate Director)

Mobile: 0402 810 425

Email: mwalsh@bne.mcgees.com.au

Mel Evans

Valuation Consultant

Mobile: 0419 722 134

Email: mevans@bne.mcgees.com.au

References

CBRE. (2025). Australia office marketview: Real estate insights and trends. CBRE Research.

JLL. (2025). Brisbane office market report: Tenant movements and vacancy analysis. JLL Research.

MSCI. (2024). The premium office divide: Divergence in global property valuations. MSCI Real Estate Index.

NABERS. (2026). Annual performance review: Driving sustainability in commercial office property. National Australian Built Environment Rating System.

Rader, V. (2025). Commercial office dynamics and the post-pandemic workspace. Ray White Commercial Research.

For a complete list of weekly commercial transactions in Queensland, visit McGees Wrap Up | McGees Property Brisbane

Disclaimer: The information provided in this blog is for general informational purposes only and does not constitute legal, financial, or professional advice. While we strive for accuracy, we make no guarantees regarding the completeness or timeliness of the content. Always seek independent advice before making any financial or real estate decisions. We are not liable for any loss or damages arising from your reliance on the information provided.

Liability Limited by a Scheme approved under Professional Standards Legislation
Latest News

McGees Wrap Up 23 October 2026

October 23, 2026

McGees Wrap Up 23 October 2026

Queensland Commercial Property Weekly Wrap-Up Week Ending 23 October 2026 South East Queensland commercial property is accelerating as the 2032 Olympic deadline forces developers and investors to lock in projects before resource bottlenecks intensify. Population growth continues to fuel exceptional…

October 23, 2026 McGees Wrap Up
McGees Wrap Up 16 October 2026

October 16, 2026

McGees Wrap Up 16 October 2026

Market Overview Queensland commercial property is drawing intense local and cross-border capital as investors race to secure assets ahead of long-term infrastructure delivery (Bleby, 2026; Lenaghan, 2026). The Brisbane central business district office sector has reached Australia's tightest vacancy rate…

October 16, 2026 McGees Wrap Up
McGees Wrap Up 9 October 2026

October 9, 2026

McGees Wrap Up 9 October 2026

Market Overview South East Queensland commercial property continues to experience fierce capital competition driven by severe supply constraints and infrastructure connectivity. While broader macroeconomic headwinds such as falling building approvals and rising retail operational costs challenge feasibility, developers and investors…

October 9, 2026 McGees Wrap Up

October 1, 2026

McGees Wrap Up 2 October 2026

Rising sovereign bond yields and tight consumer budgets are testing commercial property valuations across Queensland, but capital continues to find a home where tenant demand and infrastructure investment remain clear. Australian ten-year government bond yields have climbed past 5.3 per…

October 1, 2026 McGees Wrap Up
View all

Over 45 years of national property excellence.

Contact our experienced team today.

First Name(Required)
Last Name(Required)

Australia Property Market Insights March 2026

March 31, 2026

Market Commentary March 2026

The Australian economy is in a delicate transitional phase, with growth picking up, but inflationary pressures dictating a cautious monetary policy approach.

Australian Economic Overview

2.6%

Economic Growth

As of December 2025, Annual economic growth was 2.6%, reflecting an increase in government expenditure (0.9%) and house hold consumption (0.3%).

⬆
4.1%

Labour Market

Labour market conditions remain tight, with the unemployment rate holding steady at 4.1% in January. Despite rising slightly to 5.9%, the underemployment rate was still lower than a year ago.

➡
3.8%

Inflation & Wages

Inflation picked up in late 2025, with headline CPI at 3.8% and underlying inflation at 3.4%, leading the RBA to tighten in March 2026.

⬆
4.1%

Cash Rate

Spending was 4.6% year on year as of January 2026, boosting GPD, however expected to ease off with the increased cash rate now at 4.10%.

⬆
Increase

Housing Finance

The number of new loan commitments for dwellings rose 5.1% from the September quarter to the December quarter. Reflecting the impact of the 5% Deposit Scheme for first-home buyers.

⬆
Stable

Labour Productivity

Labour market conditions remain tight, with the unemployment rate holding steady at 4.1% in January. Despite rising slightly to 5.9%, the underemployment rate was still lower than a year ago.

➡

Source: API, March 2026 Update

Cash Rate

In the March 2026 meeting, the Board judged that inflation is likely to remain above target for some time and that the risks have tilted further to the upside, including to inflation expectations. It was therefore appropriate to increase the cash rate target.

Market Drivers & Challenges

Economic Drivers

  • Consumption
  • Investment
  • Exports

Growth Sectors

  • Renewable Energy
  • Healthcare
  • Technology
  • Construction
  • Tourism
  • Education

Declining Sectors

  • Coal and Traditional Fossil Fuel Mining

Challenges

  • Inflationary Pressures and Housing
  • Rising Unemployment
  • Global Trade Uncertainty

National Trends

Commercial

According to Real Capital Analytics (MSCI), Australia’s broader deal volume surged by close to 75% YOY in the third quarter. Deal activity increased across major property types except for office, where the recovery has stalled. Recovery can also be attributed to the return of cross-border capital. Net capital inflows by overseas investors were flat for the majority of 2023-24 before soaring to over circa $5b year to date, courtesy of some major portfolio acquisitions across industrial, living and data centre sectors.

Brisbane was Australia’s top-performing commercial market in late 2025, with transaction volumes. As of February 2026, Industrial demand continues to outstrip supply in most precincts. Retail activity increases in the 2nd Half of 2025. The office market is demonstrating increased rentals during a “flight to quality” with a performance gap between prime and secondary assets. However, it is also noted that a lack of future projects is expected to impact demand in 2026.

Superannuaction Changes

A Bill for proposed Tax Legislation was passed in Parliament in March 2026 and is now set to be implemented as Legislation effective as of 1 July 2026. This Treasury Laws Amendment (Building a Stronger and Fairer Super System) Bill 2026 proposes a new tax on superannuation balances exceeding $3 million to reduce concessions for high-balance individuals. It also aligns the Low-Income Superannuation Tax Offset (LISTO) with income tax thresholds and introduces consequential amendments across nine different Acts. Source: https://www.aph.gov.au

Due to the change of tax rates associated with the Amendment, these changes are expected to directly impace Self-Managed Super Investors with qualifying balances, resulting in potential changes to ownership structures and investmen feasibilities.

Residential

The Australian residential market entered 2026 with a “two-speed” dynamic, as national values rose 0.8% in January to an annual growth rate of 10.2%. While the RBA’s February hike to 3.85% is expected to moderate demand, chronic supply shortages—with listings 25% below the five-year average—continue to provide a firm floor for prices. Growth is increasingly concentrated in the affordable unit segment and smaller capitals, as Sydney and Melbourne soften under higher borrowing costs. Brisbane and SEQ remain the national frontrunners, driven by Australia’s highest interstate migration and an acute supply deficit. Brisbane house prices are forecast to grow by 10.9% in 2026, supported by a massive $116.8 billion infrastructure pipeline. With vacancy rates remaining near record lows and the market projected to fall 262,000 homes short of national targets, the outlook remains skewed toward sustained capital appreciation and rental growth throughout the year. This continues to influence demand for professional property valuations.

Make informed property decisions in a changing market.
Speak with our team for a professional property valuation or strategic advice.

Request a valuation

For a complete list of weekly commercial transactions in Queensland, visit McGees Wrap Up | McGees Property Brisbane

Disclaimer: The information provided in this blog is for general informational purposes only and does not constitute legal, financial, or professional advice. While we strive for accuracy, we make no guarantees regarding the completeness or timeliness of the content. Always seek independent advice before making any financial or real estate decisions. We are not liable for any loss or damages arising from your reliance on the information provided.

Liability Limited by a Scheme approved under Professional Standards Legislation
Latest News

McGees Wrap Up 23 October 2026

October 23, 2026

McGees Wrap Up 23 October 2026

Queensland Commercial Property Weekly Wrap-Up Week Ending 23 October 2026 South East Queensland commercial property is accelerating as the 2032 Olympic deadline forces developers and investors to lock in projects before resource bottlenecks intensify. Population growth continues to fuel exceptional…

October 23, 2026 McGees Wrap Up
McGees Wrap Up 16 October 2026

October 16, 2026

McGees Wrap Up 16 October 2026

Market Overview Queensland commercial property is drawing intense local and cross-border capital as investors race to secure assets ahead of long-term infrastructure delivery (Bleby, 2026; Lenaghan, 2026). The Brisbane central business district office sector has reached Australia's tightest vacancy rate…

October 16, 2026 McGees Wrap Up
McGees Wrap Up 9 October 2026

October 9, 2026

McGees Wrap Up 9 October 2026

Market Overview South East Queensland commercial property continues to experience fierce capital competition driven by severe supply constraints and infrastructure connectivity. While broader macroeconomic headwinds such as falling building approvals and rising retail operational costs challenge feasibility, developers and investors…

October 9, 2026 McGees Wrap Up

October 1, 2026

McGees Wrap Up 2 October 2026

Rising sovereign bond yields and tight consumer budgets are testing commercial property valuations across Queensland, but capital continues to find a home where tenant demand and infrastructure investment remain clear. Australian ten-year government bond yields have climbed past 5.3 per…

October 1, 2026 McGees Wrap Up
View all

Over 45 years of national property excellence.

Contact our experienced team today.

First Name(Required)
Last Name(Required)

The Education Asset Opportunity: Why Private School Valuations are Surging

March 5, 2026

A Special Advisory from the Valuation and Professional Services Division

Why the Unprecedented Boom in Private Education Demands a Revaluation of Your Assets Today.

By Michael Walsh and Mel Evans

Dear School Administrator, Board Member, or Financial Director,

The Australian private school sector is experiencing a structural renaissance. If your institution has not commissioned a comprehensive valuation of its land and infrastructure within the last twenty-four months, your balance sheet is likely failing to reflect reality.

Consider the macro environment. Comprising both Independent and Catholic institutions, the private sector has recorded sustained, long-term growth. In the year 2024 alone, Independent schools enrolled 692,271 students. This accounts for a commanding 16.8 percent of all enrolments nationwide. When we analyse the previous five years, the growth is staggering: an 18.5 percent expansion, representing the strongest performance of any educational sector.

The Decade of Independent Expansion

A 30.7 percent rise in enrolments since 2014 demonstrates a permanent market shift. This is not a temporary trend but a definitive movement toward private education models that offer greater choice and specialised pastoral support.

Source: Australian Curriculum, Assessment and Reporting Authority (2024)

The Post COVID-19 Reality: A Flight to Quality

Following the disruptions of recent years, private schools demonstrated remarkable enrolment resilience. Between 2023 and 2024, non-government enrolments increased by 2.7 percent. To place this into context, this figure significantly outpaced government school growth, which stagnated at a mere 0.2 percent.

Within this cohort, the Independent sector surged by 3.8 percent from 2022 to 2023, marking its fastest rise in over a decade. Why is this occurring? Parents consistently cite educational quality, perceived safety, and dissatisfaction with public sector resourcing. Despite nationwide cost-of-living pressures, parents increasingly view school choice and pastoral support as non-discretionary investments.

Source: Independent Schools Australia (2024)

The Queensland Phenomenon

Nowhere is this shift more pronounced than in Queensland. Our state’s Independent sector outperformed all other schooling types recently, enrolling 154,266 students across 234 schools in 2024. Enrolments rose by an impressive 4.8 percent, surpassing Catholic schools at 1.5 percent, while the government sector contracted by 0.4 percent.

South East Queensland is the epicentre of this boom. Economic modelling reveals that independent schools contribute heavily to regional economies. This growth translates directly into immense pressure on existing infrastructure and a rapid appreciation in the value of educational real estate. South East Queensland is projected to accommodate a substantial share of the 90,000 additional students expected in the coming decades.

Source: Independent Schools Queensland (2025)

The Return of the International Market

We must also factor in the lucrative international student market. While total enrolments fell sharply during the border closures of 2020 and 2021, the sector has rebounded to a record 1,095,298 overall students in 2024. Although school sector enrolments remain slightly below their 2019 peak at 19,675 students, the recovery is accelerating.

Crucially for school revenues, full-fee paying overseas school students recovered strongly, rising 23.4 percent from 2023 to 2024. This return to near pre-pandemic levels, led predominantly by the Chinese market representing 32 percent of enrolments, injects vital capital back into school expansion programmes.

Source: Independent Schools Australia (2024)

What This Means For Your Asset Register

Population growth alone does not fully explain this enrolment demand. It is increasingly shaped by definitive parental choice and supreme confidence in the private sector.

This is the critical juncture for your institution.

With unprecedented demand, rising tuition capacities, and massive economic footprints, the underlying value of your school’s land and built assets has fundamentally changed. If you are seeking to secure mortgage financing for new capital works, preparing financial reports for your board, or making critical acquisition decisions, relying on outdated valuations is a severe strategic misstep.

McGees Property possesses the specialised expertise required to assess complex educational facilities. We understand the zoning, the infrastructure costs, and the unique cash-flow models that define independent schools.

Do not leave your most valuable assets underutilised on paper. Secure a precise, market-reflective valuation today to empower your school’s next phase of growth.

Contact The Education Valuation Specialists

Michael Walsh

Head of Valuation and Professional Services (Associate Director)

Telephone: 0402 810 425

Email Address: mwalsh@bne.mcgees.com.au

Mel Evans

Valuation Consultant

Telephone: 0419 722 134

Email Address: mevans@bne.mcgees.com.au

References

Australian Bureau of Statistics (2024)

Schools, Australia

https://www.abs.gov.au/statistics/people/education/schools/latest-release

Australian Curriculum, Assessment and Reporting Authority (2024)

National report on schooling in Australia 2023

https://www.acara.edu.au/reporting/national-report-on-schooling-in-australia

Independent Schools Australia (2024)

Sector growth data and trends

https://isa.edu.au/

Independent Schools Queensland (2024)

Independent schools snapshot 2024

https://www.isq.qld.edu.au/media/independent-schools-snapshot/

Independent Schools Queensland (2025)

Economic contribution modelling

https://www.isq.qld.edu.au/media/funding-independent-schools/

Commercial Real Estate and Valuation Specialists

All data points are derived from the Australian Bureau of Statistics (2024), Independent Schools Australia (2024), the Australian Curriculum, Assessment and Reporting Authority (2024), and Independent Schools Queensland (2025). This information is provided for research and advisory purposes only.

For a complete list of weekly commercial transactions in Queensland, visit McGees Wrap Up | McGees Property Brisbane

Disclaimer: The information provided in this blog is for general informational purposes only and does not constitute legal, financial, or professional advice. While we strive for accuracy, we make no guarantees regarding the completeness or timeliness of the content. Always seek independent advice before making any financial or real estate decisions. We are not liable for any loss or damages arising from your reliance on the information provided.

Liability Limited by a Scheme approved under Professional Standards Legislation
Latest News

McGees Wrap Up 23 October 2026

October 23, 2026

McGees Wrap Up 23 October 2026

Queensland Commercial Property Weekly Wrap-Up Week Ending 23 October 2026 South East Queensland commercial property is accelerating as the 2032 Olympic deadline forces developers and investors to lock in projects before resource bottlenecks intensify. Population growth continues to fuel exceptional…

October 23, 2026 McGees Wrap Up
McGees Wrap Up 16 October 2026

October 16, 2026

McGees Wrap Up 16 October 2026

Market Overview Queensland commercial property is drawing intense local and cross-border capital as investors race to secure assets ahead of long-term infrastructure delivery (Bleby, 2026; Lenaghan, 2026). The Brisbane central business district office sector has reached Australia's tightest vacancy rate…

October 16, 2026 McGees Wrap Up
McGees Wrap Up 9 October 2026

October 9, 2026

McGees Wrap Up 9 October 2026

Market Overview South East Queensland commercial property continues to experience fierce capital competition driven by severe supply constraints and infrastructure connectivity. While broader macroeconomic headwinds such as falling building approvals and rising retail operational costs challenge feasibility, developers and investors…

October 9, 2026 McGees Wrap Up

October 1, 2026

McGees Wrap Up 2 October 2026

Rising sovereign bond yields and tight consumer budgets are testing commercial property valuations across Queensland, but capital continues to find a home where tenant demand and infrastructure investment remain clear. Australian ten-year government bond yields have climbed past 5.3 per…

October 1, 2026 McGees Wrap Up
View all

Over 45 years of national property excellence.

Contact our experienced team today.

First Name(Required)
Last Name(Required)

CBD Food and Beverage

November 12, 2024

The phrase “Survive to ’25” has gained attention, particularly in European and US commercial real estate discussions but it resonates with the current challenges facing Brisbane’s CBD retail market. As of June 2024, the city’s retail vacancy rate sits at 19.2%—the second highest in Australia, following Perth at 25.0%, (CBRE Research, August 2024).

In Brisbane, retail spending has been largely suburban based, with only 10.8% of total retail and food and drink transactions taking place in the CBD, according to Square Data, (Square, August 2024). By contrast, Melbourne sees 69% of its retail spending concentrated in the city centre, highlighting a unique decentralization in Brisbane’s market.

The Brisbane CBD historically drew visitors from the outer suburbs seeking exclusive retail experiences, acting as a destination shopping area. More recently, major suburban shopping centres like Chermside, Mount Gravatt, and Indooroopilly—with ample free parking—have become formidable competitors for inner-city shops. Additionally, the post-pandemic shift toward Work from Home and hybrid setups has reduced foot traffic in the city, challenging CBD retailers further. City shopping centre hubs such as “Uptown” and “MacArthur Central” have shown the highest vacancy rate in H1 2024 (30.2%), whereas non-core areas such as Creek Street (3.9%) or Wharf Street (0%) had a significantly tighter vacancy rate.

Source: CBRE Research, August 2024

From a recent assessment we completed we saw optimism for a potential recovery in CBD retail. Experienced operators with strong value propositions continue to perform well despite the current climate, and if vacancies remain high, effective rents may adjust, aligning with market demand. Below is a snapshot of some recent retail lease transactions completed in the Brisbane CBD:

Address

Tenant

Area
(m²)

Gross Face Annual Rental ($/m²)

Term
(Date)

570 Queen Street
Brisbane City

Hats on Queen

300

450

3 yrs
(Q3-24)

79 Adelaide Street
Brisbane City

Maniax Axe Throwing

650

600

10 yrs
(Q4-23)

195 Elizabeth Street
Brisbane City

Alice Bar

225

675

10 yrs
(Q3-23)

199 Elizabeth Street
Brisbane City

Milquetoast

100

750

5 yrs
(Q2-24)

34 Burnett Lane
Brisbane City

Hideki

100

1,225

5 yrs
(Q3-24)

293 Queen Street
Brisbane City

Hustle N Grind

50

1,300

2 yrs
(Q3-24)

For a complete list of weekly commercial transactions in Queensland, visit McGees Wrap Up | McGees Property Brisbane

Disclaimer: The information provided in this blog is for general informational purposes only and does not constitute legal, financial, or professional advice. While we strive for accuracy, we make no guarantees regarding the completeness or timeliness of the content. Always seek independent advice before making any financial or real estate decisions. We are not liable for any loss or damages arising from your reliance on the information provided.

Liability Limited by a Scheme approved under Professional Standards Legislation

Latest News

McGees Wrap Up 23 October 2026

October 23, 2026

McGees Wrap Up 23 October 2026

Queensland Commercial Property Weekly Wrap-Up Week Ending 23 October 2026 South East Queensland commercial property is accelerating as the 2032 Olympic deadline forces developers and investors to lock in projects before resource bottlenecks intensify. Population growth continues to fuel exceptional…

October 23, 2026 McGees Wrap Up
McGees Wrap Up 16 October 2026

October 16, 2026

McGees Wrap Up 16 October 2026

Market Overview Queensland commercial property is drawing intense local and cross-border capital as investors race to secure assets ahead of long-term infrastructure delivery (Bleby, 2026; Lenaghan, 2026). The Brisbane central business district office sector has reached Australia's tightest vacancy rate…

October 16, 2026 McGees Wrap Up
McGees Wrap Up 9 October 2026

October 9, 2026

McGees Wrap Up 9 October 2026

Market Overview South East Queensland commercial property continues to experience fierce capital competition driven by severe supply constraints and infrastructure connectivity. While broader macroeconomic headwinds such as falling building approvals and rising retail operational costs challenge feasibility, developers and investors…

October 9, 2026 McGees Wrap Up

October 1, 2026

McGees Wrap Up 2 October 2026

Rising sovereign bond yields and tight consumer budgets are testing commercial property valuations across Queensland, but capital continues to find a home where tenant demand and infrastructure investment remain clear. Australian ten-year government bond yields have climbed past 5.3 per…

October 1, 2026 McGees Wrap Up
View all

Over 45 years of national property excellence.

Contact our experienced team today.

First Name(Required)
Last Name(Required)

Self Managed Superannuation Fund Valuations

October 29, 2024

According to the Australian Taxation Office, every year you need to value your Self-Managed Superannuation Fund (SMSF) assets and provide supporting evidence to your auditor.

A key responsibility SMSF trustees have every income year is valuing your fund’s assets at ‘market value’.

You should use a qualified independent valuer if:

  • the value of a fund asset represents a significant proportion of the fund’s value
  • the nature of the asset indicates that the valuation is likely to be complex or difficult.

Property values can be affected by a change in market conditions, or events such as a natural disaster, global pandemic (such as COVID-19) or rising interest rates. Furthermore, if an external valuation has become materially inaccurate, or the value of an asset has changed significantly since it was last valued, you should no longer rely on it. You should obtain a new valuation or use other forms of evidence to support your determination of the asset’s market value.

McGees Property undertakes valuations for clients with SMSF assets and can help you with your valuation requirements.

For a complete list of weekly commercial transactions in Queensland, visit McGees Wrap Up | McGees Property Brisbane

Disclaimer: The information provided in this blog is for general informational purposes only and does not constitute legal, financial, or professional advice. While we strive for accuracy, we make no guarantees regarding the completeness or timeliness of the content. Always seek independent advice before making any financial or real estate decisions. We are not liable for any loss or damages arising from your reliance on the information provided.

Liability Limited by a Scheme approved under Professional Standards Legislation

Latest News

McGees Wrap Up 23 October 2026

October 23, 2026

McGees Wrap Up 23 October 2026

Queensland Commercial Property Weekly Wrap-Up Week Ending 23 October 2026 South East Queensland commercial property is accelerating as the 2032 Olympic deadline forces developers and investors to lock in projects before resource bottlenecks intensify. Population growth continues to fuel exceptional…

October 23, 2026 McGees Wrap Up
McGees Wrap Up 16 October 2026

October 16, 2026

McGees Wrap Up 16 October 2026

Market Overview Queensland commercial property is drawing intense local and cross-border capital as investors race to secure assets ahead of long-term infrastructure delivery (Bleby, 2026; Lenaghan, 2026). The Brisbane central business district office sector has reached Australia's tightest vacancy rate…

October 16, 2026 McGees Wrap Up
McGees Wrap Up 9 October 2026

October 9, 2026

McGees Wrap Up 9 October 2026

Market Overview South East Queensland commercial property continues to experience fierce capital competition driven by severe supply constraints and infrastructure connectivity. While broader macroeconomic headwinds such as falling building approvals and rising retail operational costs challenge feasibility, developers and investors…

October 9, 2026 McGees Wrap Up

October 1, 2026

McGees Wrap Up 2 October 2026

Rising sovereign bond yields and tight consumer budgets are testing commercial property valuations across Queensland, but capital continues to find a home where tenant demand and infrastructure investment remain clear. Australian ten-year government bond yields have climbed past 5.3 per…

October 1, 2026 McGees Wrap Up
View all

Over 45 years of national property excellence.

Contact our experienced team today.

First Name(Required)
Last Name(Required)

Build to Rent (BTR) Activity in Brisbane’s Fringe

October 14, 2024

Overview of the Brisbane Fringe Market · The Brisbane Fringe commercial market is undergoing a significant transformation, driven by rising institutional demand for Build to Rent (BTR) developments. This shift reflects changing investment strategies and a strong interest in the rental sector.

Key BTR Projects
Prominent sites like 458 Wickham Street and 50 Constance Street in Fortitude Valley, originally planned for commercial towers, are being repurposed for BTR projects. This trend highlights the growing potential of the BTR sector in Brisbane.

Feasibility Challenges
Despite a robust pipeline of approved BTR projects, many have yet to progress to construction. Several factors contribute to this stagnation, including:

  • High Construction Costs: The rising expenses associated with building materials and labor are creating financial pressures.
  • Lengthy Timelines: Extended project timelines can deter investment and slow down development.
  • Shortage of Experienced Builders: A lack of skilled builders in Brisbane hampers the construction of new projects.

Impact on Commercial Developments
These feasibility hurdles are also affecting the initiation of new commercial developments. Higher funding costs and the demand for greater returns complicate the financial viability of these projects.

Market Demand and Supply Constraints
According to the Property Council of Australia, demand for A-grade office spaces remains strong. However, the market is constrained by limited new supply. This imbalance is likely to tighten market conditions further, especially as Queensland’s population continues to grow at one of the fastest rates in the country.

Recent Transactions
Recent transactions in the BTR sector underscore its activity and evolving impact on the Brisbane Fringe commercial property market.

* Sale prices obtained from RPData Pty Ltd trading as CoreLogic Asia Pacific (CoreLogic).

For a complete list of weekly commercial transactions in Queensland, visit McGees Wrap Up | McGees Property Brisbane

Disclaimer: The information provided in this blog is for general informational purposes only and does not constitute legal, financial, or professional advice. While we strive for accuracy, we make no guarantees regarding the completeness or timeliness of the content. Always seek independent advice before making any financial or real estate decisions. We are not liable for any loss or damages arising from your reliance on the information provided.

Liability Limited by a Scheme approved under Professional Standards Legislation

Latest News

McGees Wrap Up 23 October 2026

October 23, 2026

McGees Wrap Up 23 October 2026

Queensland Commercial Property Weekly Wrap-Up Week Ending 23 October 2026 South East Queensland commercial property is accelerating as the 2032 Olympic deadline forces developers and investors to lock in projects before resource bottlenecks intensify. Population growth continues to fuel exceptional…

October 23, 2026 McGees Wrap Up
McGees Wrap Up 16 October 2026

October 16, 2026

McGees Wrap Up 16 October 2026

Market Overview Queensland commercial property is drawing intense local and cross-border capital as investors race to secure assets ahead of long-term infrastructure delivery (Bleby, 2026; Lenaghan, 2026). The Brisbane central business district office sector has reached Australia's tightest vacancy rate…

October 16, 2026 McGees Wrap Up
McGees Wrap Up 9 October 2026

October 9, 2026

McGees Wrap Up 9 October 2026

Market Overview South East Queensland commercial property continues to experience fierce capital competition driven by severe supply constraints and infrastructure connectivity. While broader macroeconomic headwinds such as falling building approvals and rising retail operational costs challenge feasibility, developers and investors…

October 9, 2026 McGees Wrap Up

October 1, 2026

McGees Wrap Up 2 October 2026

Rising sovereign bond yields and tight consumer budgets are testing commercial property valuations across Queensland, but capital continues to find a home where tenant demand and infrastructure investment remain clear. Australian ten-year government bond yields have climbed past 5.3 per…

October 1, 2026 McGees Wrap Up
View all

Over 45 years of national property excellence.

Contact our experienced team today.

First Name(Required)
Last Name(Required)

Real Estate Valuations for Financial Reporting in 2024

September 26, 2024

In 2024, real estate valuations play an increasingly crucial role in financial reporting, particularly for compliance with key accounting standards. For many businesses, understanding the nuances of real estate valuation ensures their financial statements are accurate and compliant. One of the core principles guiding these valuations is International Financial Reporting Standards (IFRS) 13, Fair Value Measurement. In Australia, this is mirrored by the Australian Accounting Standards Board (AASB) in AASB 13 Fair Value Measurement, enacted under section 334 of the Corporations Act 2001.

What is Fair Value Measurement?

Fair Value, as defined by AASB 13, is:

” … to estimate the price at which an orderly transaction to sell the asset or transfer the liability would take place between market participants at the measurement date under current market conditions (i.e., an exit price at the measurement date from the perspective of a market participant that holds the asset or owes the liability).”

This definition emphasizes that Fair Value is market-based, focusing on the price achievable between independent parties in an open market. Importantly, this value is not based on an entity’s specific intentions or internal metrics but reflects broader market conditions and assumptions about risk.

Key Considerations for Real Estate Valuations

When applying Fair Value in real estate valuations for financial reporting, several critical issues must be addressed:

  • Exit Value: The valuation must reflect the ‘exit’ value, representing the price a market participant would receive for selling the asset, rather than a specific value to the holder.

  • Unit of Account: Correctly determining the ‘unit of account’ is essential. This refers to the asset being valued or the scope of what’s included in the valuation.

  • Highest and Best Use: For non-financial assets like real estate, the valuation should reflect its ‘highest and best use,’ considering what use would generate the most economic benefits.

These factors ensure that valuations are transparent, reliable, and reflective of real market conditions.

Fair Value Hierarchy

AASB 13 also introduces a Fair Value Hierarchy to standardize the inputs used in valuations. This hierarchy consists of three levels, prioritizing observable inputs from active markets:

  • Level 1: Quoted prices (unadjusted) in active markets for identical assets or liabilities.

  • Level 2: Inputs other than quoted prices that are observable, either directly or indirectly.

  • Level 3: Unobservable inputs based on the entity’s assumptions, typically used when market data is not available.

The hierarchy ensures consistency and comparability across valuations, which is especially important when reporting for stakeholders and investors.

Real Estate Valuations and Financial Reporting

When conducting real estate valuations for financial reporting purposes, businesses need to ensure that all relevant standards, such as AASB 13, are adhered to. This guarantees that valuations accurately reflect current market conditions and are comparable across industries and markets. Given the complexities involved, professional valuers who specialize in financial reporting can help navigate these requirements, ensuring compliance and accurate financial representation.

At McGees, we specialize in real estate valuations for financial reporting, offering expert guidance to ensure your property assets are accurately reflected in your financial statements. Our experienced team is well-versed in applying AASB 13 and other relevant standards, providing valuations that meet regulatory requirements and offer clarity to stakeholders.

For a complete list of weekly commercial transactions in Queensland, visit McGees Wrap Up | McGees Property Brisbane

Disclaimer: The information provided in this blog is for general informational purposes only and does not constitute legal, financial, or professional advice. While we strive for accuracy, we make no guarantees regarding the completeness or timeliness of the content. Always seek independent advice before making any financial or real estate decisions. We are not liable for any loss or damages arising from your reliance on the information provided.

Liability Limited by a Scheme approved under Professional Standards Legislation

Latest News

McGees Wrap Up 23 October 2026

October 23, 2026

McGees Wrap Up 23 October 2026

Queensland Commercial Property Weekly Wrap-Up Week Ending 23 October 2026 South East Queensland commercial property is accelerating as the 2032 Olympic deadline forces developers and investors to lock in projects before resource bottlenecks intensify. Population growth continues to fuel exceptional…

October 23, 2026 McGees Wrap Up
McGees Wrap Up 16 October 2026

October 16, 2026

McGees Wrap Up 16 October 2026

Market Overview Queensland commercial property is drawing intense local and cross-border capital as investors race to secure assets ahead of long-term infrastructure delivery (Bleby, 2026; Lenaghan, 2026). The Brisbane central business district office sector has reached Australia's tightest vacancy rate…

October 16, 2026 McGees Wrap Up
McGees Wrap Up 9 October 2026

October 9, 2026

McGees Wrap Up 9 October 2026

Market Overview South East Queensland commercial property continues to experience fierce capital competition driven by severe supply constraints and infrastructure connectivity. While broader macroeconomic headwinds such as falling building approvals and rising retail operational costs challenge feasibility, developers and investors…

October 9, 2026 McGees Wrap Up

October 1, 2026

McGees Wrap Up 2 October 2026

Rising sovereign bond yields and tight consumer budgets are testing commercial property valuations across Queensland, but capital continues to find a home where tenant demand and infrastructure investment remain clear. Australian ten-year government bond yields have climbed past 5.3 per…

October 1, 2026 McGees Wrap Up
View all

Over 45 years of national property excellence.

Contact our experienced team today.

First Name(Required)
Last Name(Required)

Commercial Market CBD North Fringe – Bowen Hills and Fortitude Valley

September 17, 2024

The Northern Fringe of Brisbane, including key suburbs like Bowen Hills and Fortitude Valley, continues solidifying its position as one of the most sought-after commercial investment areas. Known as the Urban Renewal Precinct, this region benefits from Brisbane’s strong population growth and robust economic performance, making it a hub for investors and businesses alike.

Population Growth and Economic Strength

Queensland’s population is expanding at a rapid pace, with an annual growth rate of 2.6%. This demographic boost, coupled with an expected 3.2% annual increase in the state’s economy over the next two years, is a significant driver behind the sustained demand for commercial property. The influx of residents and businesses into the area is creating a dynamic environment where commercial spaces are in high demand, pushing rental rates and property values upward.

Limited Supply Driving Rental Growth

A combination of high construction costs and financial constraints has limited new supply in the Northern Fringe. This scarcity is already translating into rental growth as businesses compete for available space. The limited availability, alongside Brisbane’s growing role as a destination for corporate relocation and talent migration, ensures that the area remains a prime location for future investment.

Strategic Location and Infrastructure Advantage

The North Fringe benefits from excellent connectivity, modern infrastructure, and proximity to the Brisbane CBD. This strategic positioning, combined with the area’s appeal to both established businesses and startups, offers investors stable yields and long-term growth potential. As Brisbane continues to evolve as an economic powerhouse, the Northern Fringe’s commercial landscape is expected to witness significant appreciation.

Recent Investment Sales in Bowen Hills and Fortitude Valley

To illustrate the region’s strong performance, here are some of the recent notable transactions in Bowen Hills and Fortitude Valley:

*Data sourced from RPData Pty Ltd trading as CoreLogic Asia Pacific (CoreLogic).

Analysis of Recent Transactions:

  • 123 Gotha Street, Fortitude Valley: Sold for $9.725M in May 2023 with a large land area of 902 m² and building size of 1,639 m², offering an initial yield of 9.3%. This transaction represents a significant investment in a property with considerable floor space and a solid return.

  • 168 Knapp Street, Fortitude Valley: Acquired in October 2023 for $3.275M, this smaller-scale property with a land area of 344 m² and 398 m² of buildings offers an attractive yield of 7.6%. With a high building analysis rate of $8,200 per square meter, the investment promises solid capital growth potential.

  • 157 Abbotsford Road, Bowen Hills: At $2.55M for a larger land size of 965 m² and 1,016 m² of buildings, this property shows a moderate initial yield of 7.3%. The relatively low building analysis cost of $2,500 per square meter indicates potential for value uplift through renovation or redevelopment.

  • 45 Amelia Street, Fortitude Valley: Sold for $3.9M in March 2024, this mid-sized property with 430 m² of land and 419 m² of building space offers a lower yield of 5.3%. However, with a high building analysis rate of $9,300 per square meter, this asset likely benefits from a prime location or premium tenants.

Investor Takeaway:

  • Yield Stability and Growth Potential: The yields across these properties range from 5.3% to 9.3%, offering both stable returns and the potential for future growth. Investors seeking long-term capital appreciation and secure cash flow will find properties in Fortitude Valley and Bowen Hills particularly appealing.

  • Future Value Uplift: Given the limited supply and strong demand drivers, investors should expect continued rental growth and capital appreciation. Properties in this area are likely to increase in value, especially with Brisbane’s anticipated economic expansion and the region’s growing role in attracting corporate relocations.

  • Attractive Entry Points: While yields vary, the combination of strategic location, economic strength, and limited new supply make these investments promising. Investors should look for opportunities to purchase properties with the potential for value-add improvements, such as increasing building space or upgrading facilities.

Investment Outlook

Looking ahead, the commercial property market in Brisbane’s Northern Fringe is expected to see continued demand buoyed by population growth, limited supply, and strong economic fundamentals. Investors looking for stable returns, coupled with long-term capital growth, will find the North Fringe to be an attractive proposition, particularly in high-demand areas like Bowen Hills and Fortitude Valley.

For a complete list of weekly commercial transactions in Queensland, visit McGees Wrap Up | McGees Property Brisbane

Disclaimer: The information provided in this blog is for general informational purposes only and does not constitute legal, financial, or professional advice. While we strive for accuracy, we make no guarantees regarding the completeness or timeliness of the content. Always seek independent advice before making any financial or real estate decisions. We are not liable for any loss or damages arising from your reliance on the information provided.

Liability Limited by a Scheme approved under Professional Standards Legislation
Latest News

McGees Wrap Up 23 October 2026

October 23, 2026

McGees Wrap Up 23 October 2026

Queensland Commercial Property Weekly Wrap-Up Week Ending 23 October 2026 South East Queensland commercial property is accelerating as the 2032 Olympic deadline forces developers and investors to lock in projects before resource bottlenecks intensify. Population growth continues to fuel exceptional…

October 23, 2026 McGees Wrap Up
McGees Wrap Up 16 October 2026

October 16, 2026

McGees Wrap Up 16 October 2026

Market Overview Queensland commercial property is drawing intense local and cross-border capital as investors race to secure assets ahead of long-term infrastructure delivery (Bleby, 2026; Lenaghan, 2026). The Brisbane central business district office sector has reached Australia's tightest vacancy rate…

October 16, 2026 McGees Wrap Up
McGees Wrap Up 9 October 2026

October 9, 2026

McGees Wrap Up 9 October 2026

Market Overview South East Queensland commercial property continues to experience fierce capital competition driven by severe supply constraints and infrastructure connectivity. While broader macroeconomic headwinds such as falling building approvals and rising retail operational costs challenge feasibility, developers and investors…

October 9, 2026 McGees Wrap Up

October 1, 2026

McGees Wrap Up 2 October 2026

Rising sovereign bond yields and tight consumer budgets are testing commercial property valuations across Queensland, but capital continues to find a home where tenant demand and infrastructure investment remain clear. Australian ten-year government bond yields have climbed past 5.3 per…

October 1, 2026 McGees Wrap Up
View all

Over 45 years of national property excellence.

Contact our experienced team today.

First Name(Required)
Last Name(Required)

Brisbane Southside Industrial Vacant Land Market

September 3, 2024

The industrial property market in Brisbane’s southside is undergoing significant shifts driven by high debt costs and limited land supply. Developers face challenges with speculative developments as financing costs rise and market sentiment changes. This has led to a slowdown in the acquisition of vacant land, further tightening the already scarce supply of developable industrial land.

With only a tiny percentage of Brisbane’s industrial-zoned land remaining undeveloped, property investors and landlords can capitalise on the growing demand for industrial properties. As land becomes more scarce, the value of existing properties is likely to rise, making now a critical time for strategic investment. Recent transactions highlight the variance in land prices depending on location, zoning, and development readiness, offering a glimpse into the potential returns for astute investors.

In this evolving market, landlords and investors can benefit from increased demand for leasing, particularly in well-serviced and well-located industrial areas. Moreover, land banking by institutional developers signals confidence in the long-term value of industrial properties, presenting further opportunities for those prepared to take a long-term view.

For those navigating these changes, careful planning and strategic decision-making are key. Whether it is leveraging existing properties, land banking, or seeking new acquisitions, understanding the implications of high debt costs and limited land supply is crucial to maximising returns in Brisbane’s industrial sector.

1. High Debt Costs and Shifting Market Sentiment:

o Developers find it challenging to make speculative developments viable due to increased debt costs and changing market sentiment.

o This has led to a pause in speculative developers’ acquisition of vacant land.

2. Limited Supply of Industrial Land:

o Only about 11% of Brisbane’s 6,500 hectares of industrial-zoned land remains undeveloped and is accessible with suitable services.

o Recent transactions are few, typically involving institutional developers with tenant precommitments or those looking to land bank until conditions improve.

3. Notable Transactions:

o Several key land transactions are highlighted, demonstrating varying land prices and conditions depending on location, zoning, and development readiness.

Address

Land Area

Analysed Land Area

Zoning

15 Competition Street
Acacia Ridge

47,400m2

$300/m2

General Industry A

Transacted April 2024. A level, irregular shaped parcel with security fencing and holding income.

The HUB
731 Johnson Road
Heathwood

7,500m2

$500/m2

LII Low Impact Industry

Circa 25 rectangular shaped, benched and serviced parcels all sold in May 2024 to various buyers as a part of a new industrial hub.

55-63 Colebard St West
Acacia Ridge

64,500m2

$340/m2

General Industry C

Irregular shaped, level parcel of land sold in January 2023 with basic which have since been cleared.

217-223 Gilmore Road
Berrinba

9,725m2

$620/m2

Low Impact Industry

This rectangular shaped parcel of land sold in December 2023, was sold in an off-market transaction to an owner occupier.

Implications for Landlords and Property Investors:

  1. Scarcity of Developable Land:
  • With limited new developments and only a small percentage of land remaining undeveloped, the scarcity of industrial land will likely drive up the value of existing properties.
  • Landlords owning industrial properties in the area may see increased demand for leasing, leading to potentially higher rental yields.
  • High Debt Costs Affecting Development:
    • The pause in speculative developments due to high debt costs could mean less competition in the short term for existing properties.
    • For property investors, this might present an opportunity to invest in industrial properties as developers pull back, particularly if they can leverage existing assets without incurring high debt.
  • Opportunities in Land Banking:
    • Institutional developers engage in land banking, indicating a long-term view that current high-cost conditions are temporary.
    • Property investors with the capital to invest in land banking could benefit from future appreciation when market conditions normalise.
  • Leasing Potential:
    • Given the example of the 15 Competition Street transaction, where the property was leased post-sale at a competitive rate, landlords might find similar opportunities to secure tenants at favourable terms, especially in well-located, serviced parcels.
    • Investors should focus on properties with high tenant demand, which can ensure stable rental income even in challenging market conditions.
  • Market Stability and Caution:
    • The caution exhibited by developers suggests that the market is currently in a state of flux. Landlords and investors should know that while the current environment may suppress immediate development activity, the underlying value of well-positioned industrial land remains strong.
    • Investors might consider being selective, focusing on properties with good infrastructure, connectivity, and zoning that align with long-term industrial growth trends.

    The current market conditions in Brisbane’s southside industrial sector present challenges and opportunities for landlords and property investors. The scarcity of developable land and high debt costs push developers to be cautious, which could benefit those holding existing properties. Land banking and strategic acquisitions in well-serviced areas may yield significant returns when the market stabilises. Investors should watch long-term growth potential and be prepared to act when conditions become more favourable.

    Given the current dynamics in Brisbane’s southside industrial land market, now is the time to act strategically. If you are a commercial property investor or landlord, take advantage of the opportunity to capitalise on the scarcity of developable land and the increasing demand for well-located industrial properties. Consider exploring land banking options or securing existing assets to leverage future market growth.

    Contact us today for a comprehensive property valuation. Our valuation team, Scott and Owen, are ready to provide the insights needed to navigate this evolving market and maximise your investment potential. Act now to ensure you make informed decisions that will enhance your returns in Brisbane’s industrial real estate sector.

    We know Valuations. We know Queensland.

    • Scott Campbell: 0403 165 355
    • Owen Thorn: 0405 415 645

    Let’s unlock the true value of your property together.

    This Article is for general information only and should not be relied on as advice. You should consider your personal situation and seek advice that is specific to your circumstances before making any decisions based on this information. Liability limited by a scheme approved under Professional Standards Legislation

    For a complete list of weekly commercial transactions in Queensland, visit McGees Wrap Up | McGees Property Brisbane

    Disclaimer: The information provided in this blog is for general informational purposes only and does not constitute legal, financial, or professional advice. While we strive for accuracy, we make no guarantees regarding the completeness or timeliness of the content. Always seek independent advice before making any financial or real estate decisions. We are not liable for any loss or damages arising from your reliance on the information provided.

    Liability Limited by a Scheme approved under Professional Standards Legislation
    Latest News

    McGees Wrap Up 23 October 2026

    October 23, 2026

    McGees Wrap Up 23 October 2026

    Queensland Commercial Property Weekly Wrap-Up Week Ending 23 October 2026 South East Queensland commercial property is accelerating as the 2032 Olympic deadline forces developers and investors to lock in projects before resource bottlenecks intensify. Population growth continues to fuel exceptional…

    October 23, 2026 McGees Wrap Up
    McGees Wrap Up 16 October 2026

    October 16, 2026

    McGees Wrap Up 16 October 2026

    Market Overview Queensland commercial property is drawing intense local and cross-border capital as investors race to secure assets ahead of long-term infrastructure delivery (Bleby, 2026; Lenaghan, 2026). The Brisbane central business district office sector has reached Australia's tightest vacancy rate…

    October 16, 2026 McGees Wrap Up
    McGees Wrap Up 9 October 2026

    October 9, 2026

    McGees Wrap Up 9 October 2026

    Market Overview South East Queensland commercial property continues to experience fierce capital competition driven by severe supply constraints and infrastructure connectivity. While broader macroeconomic headwinds such as falling building approvals and rising retail operational costs challenge feasibility, developers and investors…

    October 9, 2026 McGees Wrap Up

    October 1, 2026

    McGees Wrap Up 2 October 2026

    Rising sovereign bond yields and tight consumer budgets are testing commercial property valuations across Queensland, but capital continues to find a home where tenant demand and infrastructure investment remain clear. Australian ten-year government bond yields have climbed past 5.3 per…

    October 1, 2026 McGees Wrap Up
    View all

    Over 45 years of national property excellence.

    Contact our experienced team today.

    First Name(Required)
    Last Name(Required)

    Market Byte Banyo Industrial

    June 18, 2024

    A recent assessment of a light industrial unit in Brisbane’s Northern Precinct has highlighted the growing popularity of these assets.

    Not just useful for a tradie shed or a big toy locker, these compact units are increasingly being utilised for warehousing/distribution by smaller online retailers, flexible exercise space by specialist gyms and office space by marketing/recruitment agencies. These light industrial units (sub $1.5 million) are seen as cost effective premises for SME owner occupiers and “stable” investment opportunities for investors alike.

    Below is a snapshot of recent industrial unit rental transactions completed in the Northern industrial precinct.

    Address

    Unit Area
    (m²)

    Net Face Annual Rent
    ($/m²)

    Annual Reviews

    12/10 Depot Street
    Banyo

    203

    182

    Greater of
    4% or CPI

    A semi-modern concrete tilt panel light industrial unit positioned to the rear of the complex. The tenant received a 2% incentive as the first month rent free.

    3/94 Delta Street
    Geebung

    262

    190

    Greater of
    3.5% or CPI

    A semi-modern concrete tilt panel light industrial unit positioned to a busy link street. The tenant received a 5% incentive as the first two months’ rent free.

    1/14 Ashtan Place
    Banyo

    261

    229

    Greater of
    3% or CPI

    A unit within a semi-modern concrete tilt panel light industrial complex positioned to the rear of the complex. The tenant received an 8% incentive as a fitout contribution.

    4/23 Ashtan Place
    Banyo

    169

    248

    Greater of
    3.5% or CPI

    A semi-modern concrete tilt panel light industrial complex positioned to the end of a cul-de-sac. Positioned to the front of the complex.

    In-Depth Analysis of Banyo and Geebung in Brisbane’s Northern Precinct

    Banyo

    Commercial Landscape: Banyo is a strategically located suburb within Brisbane’s Northern Precinct, benefiting from its proximity to major transport routes such as the Gateway Motorway and the Brisbane Airport. This accessibility makes it a prime location for various commercial activities, particularly in the industrial and logistics sectors.

    Notable Sales and Leasing Activity:

    1. Industrial Estates:

      • Banyo Business Park: Recently, there has been significant leasing activity within the Banyo Business Park, attracting logistics companies and manufacturers. The demand for large warehouse spaces has surged, driven by the growth in e-commerce and the need for efficient distribution centers.
      • Commercial Property Sales: Several industrial properties have been sold to investment firms looking to capitalize on the area’s growth. Notable transactions include the sale of multi-tenant warehouse facilities, which are now leased to diverse businesses ranging from automotive suppliers to consumer goods distributors.
    2. Retail Developments:

      • Local Shopping Centers: While Banyo is primarily known for its industrial zones, there has been a gradual increase in retail developments to cater to the growing workforce and local residents. Recent leases include anchor tenants such as supermarkets and specialty retail stores, enhancing the suburb’s commercial appeal.
    3. Office Spaces:

      • Professional Services: With the expansion of businesses in the area, there has been a rise in demand for office spaces. Several commercial buildings have been leased to professional services firms, including IT companies, consultancy agencies, and healthcare providers.

    Market Trends:

    • Growth in Logistics and Distribution: The ongoing expansion of the logistics sector continues to drive demand for industrial spaces in Banyo. Companies are seeking proximity to transport hubs to streamline their supply chains.
    • Sustainable Development: There is a noticeable trend towards sustainable and eco-friendly commercial developments, with new projects incorporating green building practices and energy-efficient designs.

    Geebung

    Commercial Landscape: Geebung is another key suburb within the Northern Precinct, recognized for its robust industrial sector and expanding commercial facilities. Its advantageous location near the Brisbane Airport and major highways enhances its attractiveness for businesses requiring efficient logistics and distribution capabilities.

    Notable Sales and Leasing Activity:

    1. Industrial and Warehouse Facilities:

      • Geebung Industrial Estate: This area has seen considerable leasing activity, with numerous warehouses being occupied by logistics companies, third-party distributors, and manufacturing firms. The demand for high-quality industrial spaces remains strong, fueled by the growth in regional trade and exports.
      • Recent Sales: Significant transactions include the sale of large-scale warehouse complexes to investment groups, who have subsequently leased these properties to a mix of national and international businesses.
    2. Commercial Office Spaces:

      • Business Centers: Geebung has experienced an uptick in the leasing of office spaces within modern business centers. These spaces are being utilized by a variety of businesses, including tech startups, financial services, and consultancy firms, seeking a presence outside the crowded Brisbane CBD.
      • Co-working Spaces: The rise of flexible work arrangements has led to the establishment of co-working spaces in Geebung, attracting freelancers, remote workers, and small enterprises.
    3. Retail and Mixed-Use Developments:

      • Shopping and Entertainment: While predominantly industrial, Geebung is gradually incorporating more retail and mixed-use developments. Recent leases include food outlets, specialty stores, and service-oriented businesses that cater to both the local population and the workforce.

    Market Trends:

    • Technological Integration: Businesses in Geebung are increasingly adopting advanced technologies such as automation and smart logistics solutions, driving the need for modern industrial infrastructure.
    • Sustainability Initiatives: Similar to Banyo, there is a growing emphasis on sustainable commercial practices. New developments are focusing on reducing environmental impact through green building materials and energy-efficient systems.

    Both Banyo and Geebung are pivotal to Brisbane’s Northern Precinct’s commercial landscape, each offering unique advantages for different sectors. The ongoing demand in industrial and logistics spaces, coupled with emerging trends in sustainability and technological integration, positions these suburbs for continued growth and investment opportunities.

    Looking to unlock the full potential of your commercial property? Whether you’re considering selling, leasing, or just want to know its true market value, McGees Property is here to help. Our expert team offers comprehensive and accurate commercial property valuations tailored to your specific needs.

    We know Valuations. We know Queensland.

    At McGees Property, we specialize in accurate and comprehensive market value assessments tailored for acquisitions, disposals, financial reporting, SMSF audits, and informed decision-making. Trust our expertise to guide you with precision and confidence.

    Should you need any valuation services, please don’t hesitate to contact:

    • Scott Campbell: 0403 165 355
    • Owen Thorn: 0405 415 645

    Let’s unlock the true value of your property together.

    This Article is for general information only and should not be relied on as advice. You should consider your personal situation and seek advice that is specific to your circumstances before making any decisions based on this information. Liability limited by a scheme approved under Professional Standards Legislation

    For a complete list of weekly commercial transactions in Queensland, visit McGees Wrap Up | McGees Property Brisbane

    Disclaimer: The information provided in this blog is for general informational purposes only and does not constitute legal, financial, or professional advice. While we strive for accuracy, we make no guarantees regarding the completeness or timeliness of the content. Always seek independent advice before making any financial or real estate decisions. We are not liable for any loss or damages arising from your reliance on the information provided.

    Liability Limited by a Scheme approved under Professional Standards Legislation
    Latest News

    McGees Wrap Up 23 October 2026

    October 23, 2026

    McGees Wrap Up 23 October 2026

    Queensland Commercial Property Weekly Wrap-Up Week Ending 23 October 2026 South East Queensland commercial property is accelerating as the 2032 Olympic deadline forces developers and investors to lock in projects before resource bottlenecks intensify. Population growth continues to fuel exceptional…

    October 23, 2026 McGees Wrap Up
    McGees Wrap Up 16 October 2026

    October 16, 2026

    McGees Wrap Up 16 October 2026

    Market Overview Queensland commercial property is drawing intense local and cross-border capital as investors race to secure assets ahead of long-term infrastructure delivery (Bleby, 2026; Lenaghan, 2026). The Brisbane central business district office sector has reached Australia's tightest vacancy rate…

    October 16, 2026 McGees Wrap Up
    McGees Wrap Up 9 October 2026

    October 9, 2026

    McGees Wrap Up 9 October 2026

    Market Overview South East Queensland commercial property continues to experience fierce capital competition driven by severe supply constraints and infrastructure connectivity. While broader macroeconomic headwinds such as falling building approvals and rising retail operational costs challenge feasibility, developers and investors…

    October 9, 2026 McGees Wrap Up

    October 1, 2026

    McGees Wrap Up 2 October 2026

    Rising sovereign bond yields and tight consumer budgets are testing commercial property valuations across Queensland, but capital continues to find a home where tenant demand and infrastructure investment remain clear. Australian ten-year government bond yields have climbed past 5.3 per…

    October 1, 2026 McGees Wrap Up
    View all

    Over 45 years of national property excellence.

    Contact our experienced team today.

    First Name(Required)
    Last Name(Required)